The Contours tool demarcates areas where defined data of one or more layers intersect spatially. This is useful in overlaying multiple data layers to define multiple parameters as criteria for site selection.
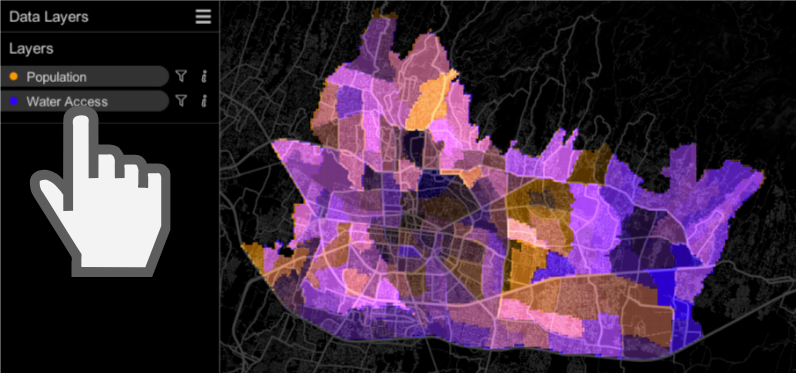
Step 1: Select Data Layers
- Select data layers to be used by clicking on them.
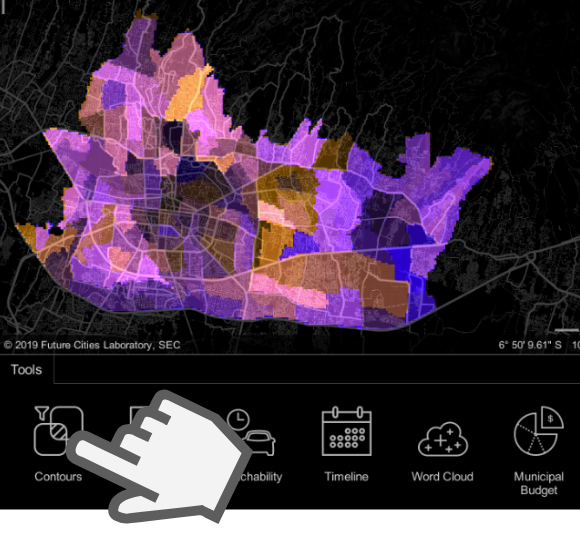
Step 2: Activate Contours Tool
- Click on the 'Contours' tool to activate it.
- This will generate the resultant contour areas which demarcate where data from your selected data layers spatially intersect.
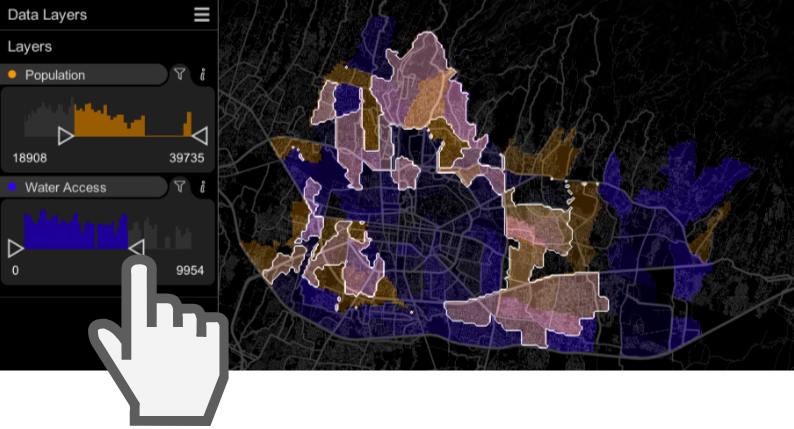
Step 3: Filter Data
- You may filter the data for each layer as you wish.
- The contour areas will be updated as you do so.
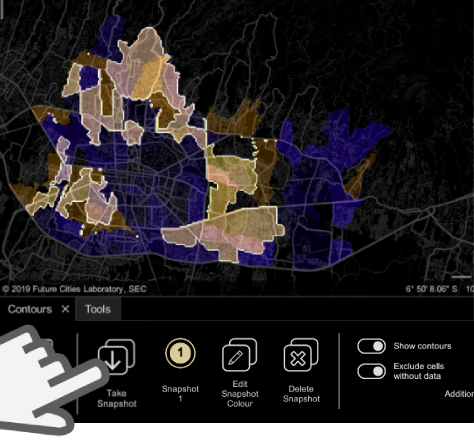
Step 4: Store a Copy of Contours (optional)
- Once you are satisfied with the contour areas generated, click on the 'Take Snapshot' to save a snapshot. Your snapshot will be saved.
- Note: You may save up to 7 snapshots, after which you will be prompted to delete a snapshot to allow for more snapshots to be taken.
Step 5: Explore Output
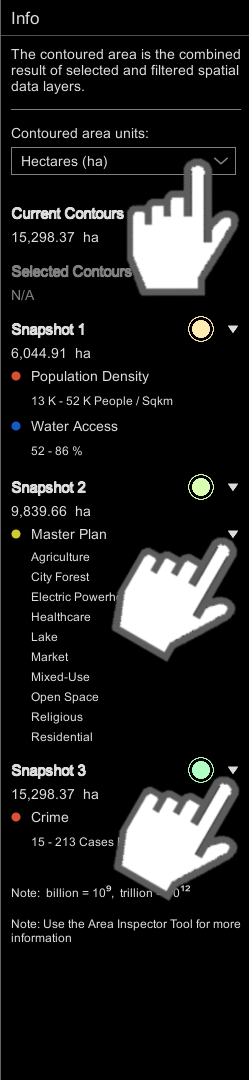
- Users can choose to display the contoured area of all the snapshots in various units:
- Hectares (ha)
- Square Kilometers (km2)
- Square Meters (m2)
- Percentage (%)
- Note: For 'Percentage' option, users can choose a snapshot for all other snapshots' area to be relative to (e.g. Snapshot2's area is 30% relative to Snapshot1's area).
- Users can collapse categorised data layer and snapshot information.
Additional Contours Settings
- Show contours: Toggles the visibility of the contours on/off.
- Show filtered data: Toggles the visibility of the filtered data in the background on/off.
- Exclude cells without data: Toggles the exclusion of cells without data on/off.
- Lock contours: Freezes the contours.