The Planning tool allows for the exploration of hypothetical planning scenarios by using simulated typologies to demonstrate the outcome of trade-off decisions. The outcomes of scenarios are clearly visualised across the following quantitative planning outcomes: population, crop production, permeable surface, gross floor area, plot ratio and water.
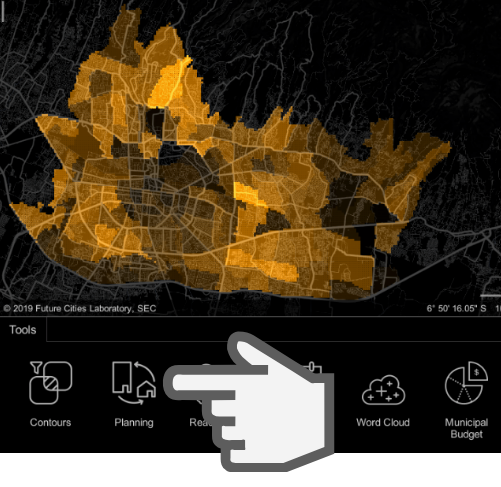
Step 1: Activate the Tool
- Zoom to a case study site.
- Click on the 'Planning' tool to activate it.
- Note: At least one data set must be selected for the tool to work.
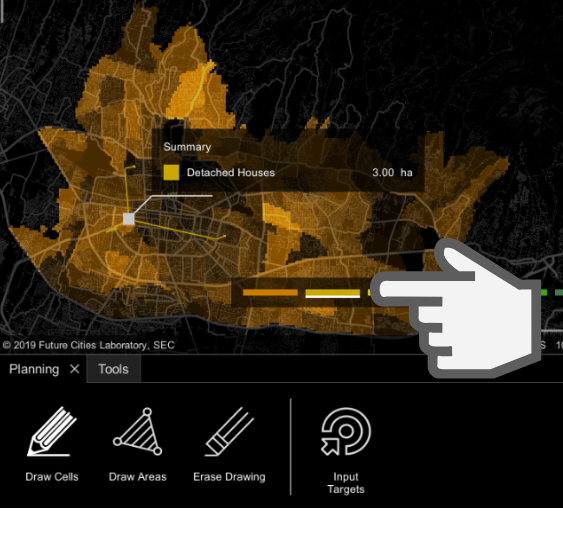
Step 2: Select Drawing Tool
- You may select either the 'Draw cell by cell' or 'Draw by shape' tool to draw.
- 'Draw cell by cell' tool: You may select individual cells to draw typologies.
- 'Draw by shape' tool: Use a polygon or free-form lasso to draw typologies over multiple cells.
- To select the tool, click on the icon representing the tool.
Step 3: Select Typology
- There are 10 typologies available: Ruko (Shop House), Rumah Tinggal (Residential House), Apartemen Tingkat Rendah (Low-Rise Apartment), Apartemen Tingkat Tinggi (High-Rise Apartment), Rumah Tambah (Expandable House), Ruang Terbuka (Public Space), Panen Bernilai Rendah (Low Value Crop), Panen Bernilai Tinggi (High Value Crop), Pedestrian Bioswale and Tanah Kosong (Bare Land).
- Select the typology to be drawn by clicking on the icon above it.
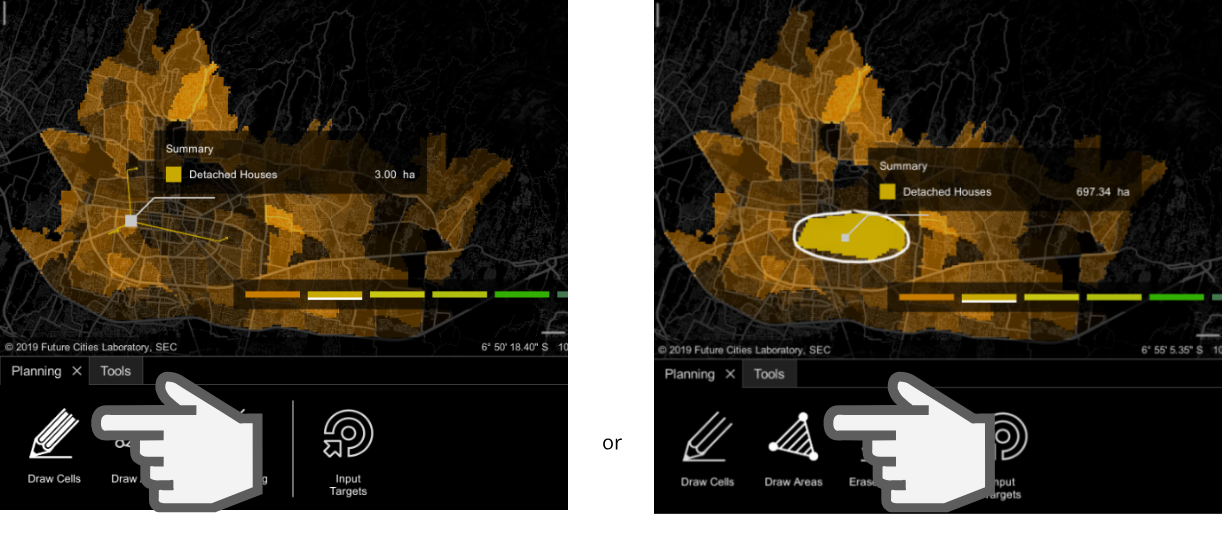
Step 4: Begin Drawing
- Prior to drawing, ensure that you have zoomed in sufficiently to allow for more accurate drawing. You can also 'right-click + drag' to pan to a 3D view.
- If you selected 'Draw cell by cell' tool, there are two ways you can draw your selected typologies:
- Click to select each cell individually to draw the typology in that cell.
- 'Click, hold + drag' over multiple cells consecutively.
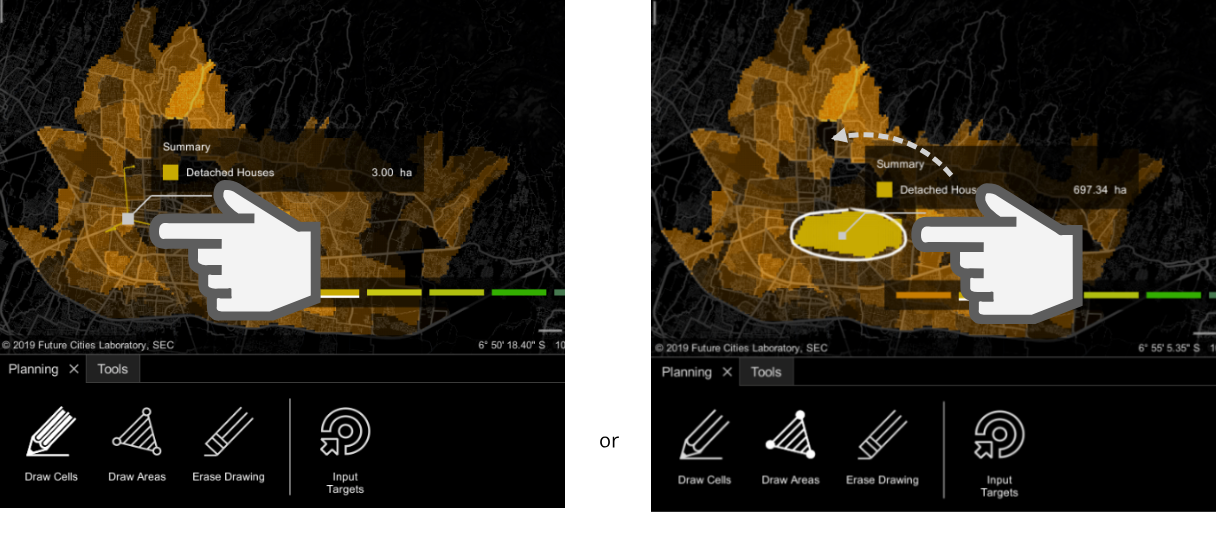
- If you selected the 'Draw by shape' tool, there are also two ways you can draw your selected typologies:
- Polygon lasso: Click multiple points to add vertices and sides of the polygon. The sides of the polygon will be drawn straight.
- Free-form lasso: 'Click + Drag' to draw a free-form lasso boundary.
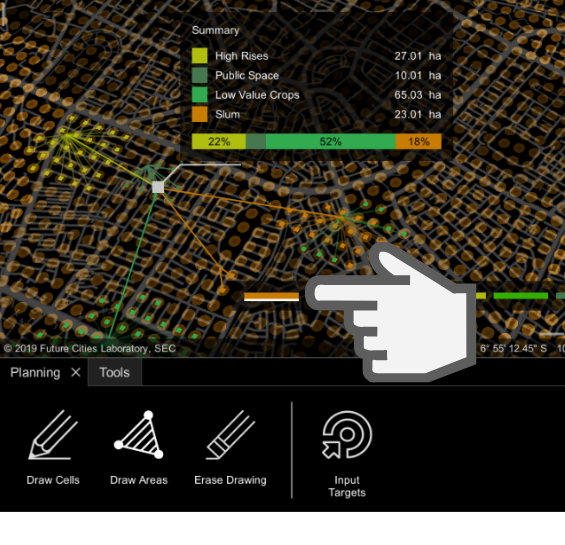
- As you draw, you will see the following:
- Typology being built on the cell(s). For example, if the 'High Rise' typology is selected, a simple high-rise tower block will be visualised over the selected cell.
- A linked bar chart over the drawn typologies. By default, this bar chart illustrates the overall change in two planning parameters - population and crop production.
- A summary of the outcome of the scenarios displayed in the Output panel on the right. This quantifies the changes across the five planning parameters: population, crops production, green cover, gross floor area and cost summary.
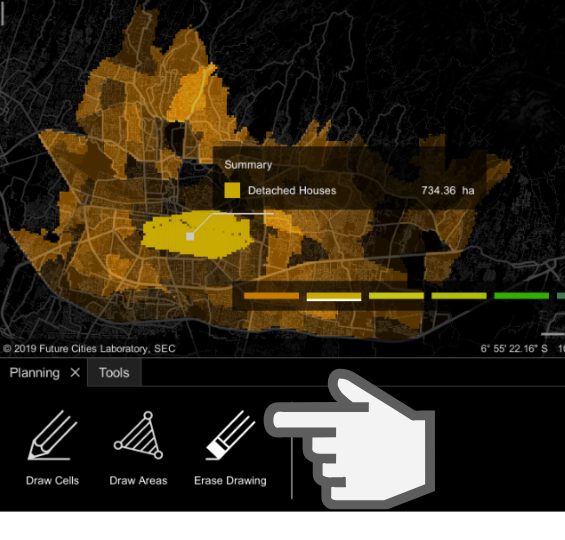
- 'Erase Typology' tool
- If you make a mistake and would like to remove the typology drawn over a particular cell or cells, click on the 'Erase typology' tool.89
- Once this tool is selected, click over the cell that you would like to erase.
Step 5: Explore on Your Own
- Draw multiple areas of different typologies: Repeat Steps 2-4, but change the typology.
- Customise the bar charts: By default, the two planning parameters shows are Population and Crops production. This can be changed or more parameters can be added by marking the checkbox in the output panel.