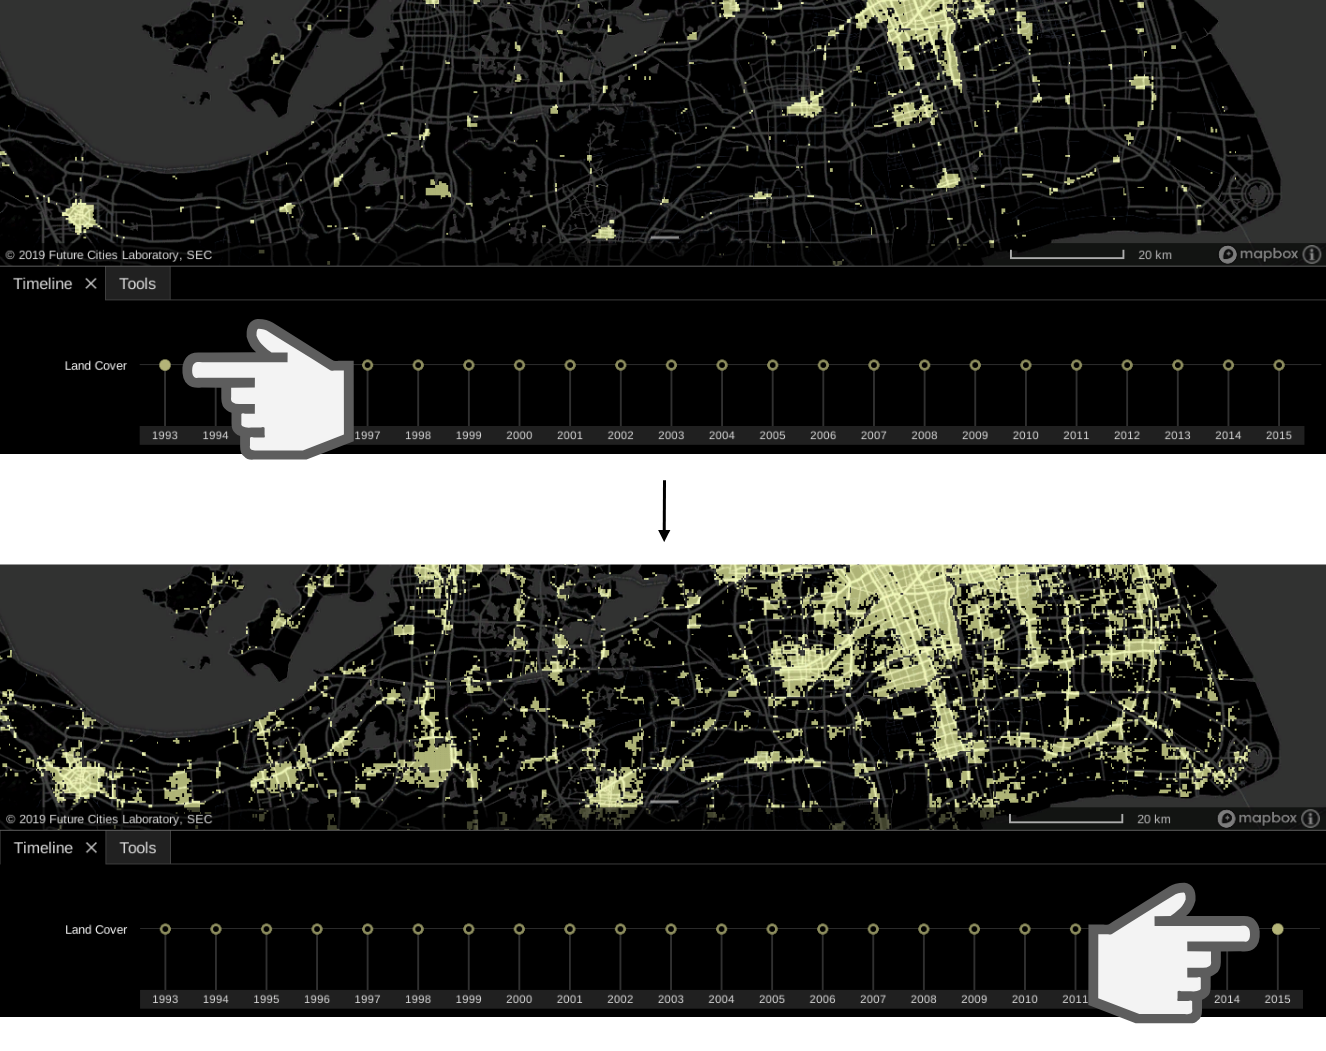
The Timeline tool displays one or more data layers over time, and allows users to observe trends and patterns of a data set/ between data sets over time.
Step 1: Switch On Data Layer with Data Over Time
- Data layer must have data over time for the given view frame - or pan to an area with data across time.
- You may select one or more data layers.
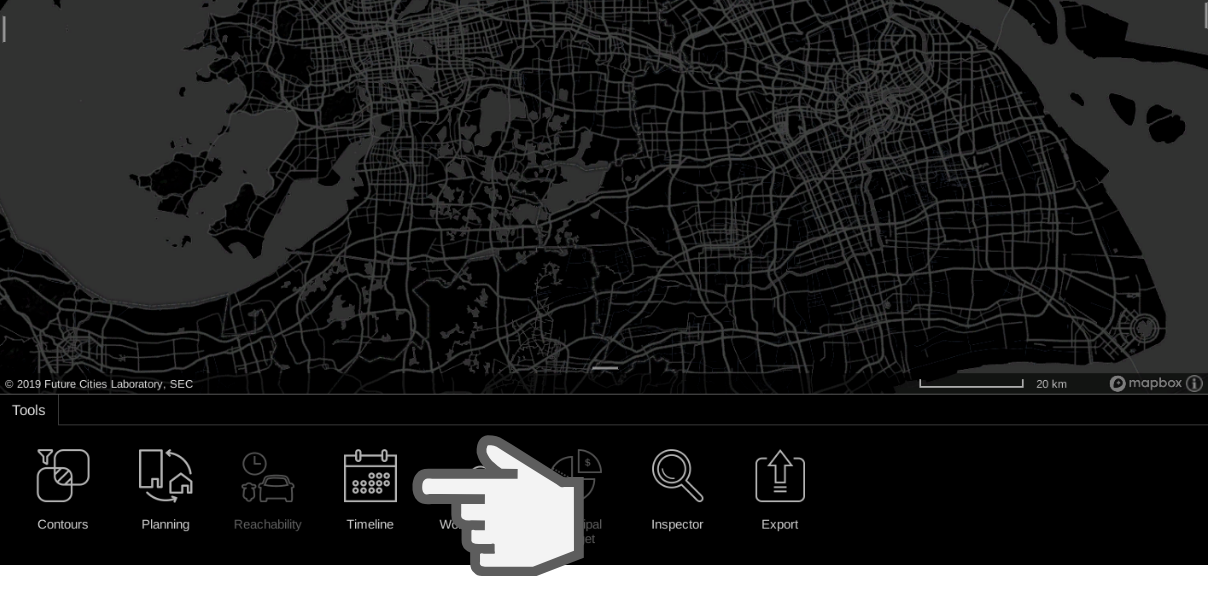
Step 2: Activate the Tool
- Click on the 'Timeline' tool to activate it.
- The timeline(s) will appear with the corresponding date of the data set.
- To navigate across time, 'Click + Drag' across the timeline. The main frame will display the data for the corresponding data.