¶ Interface overview
This section gives a brief overview of the main interface features and how to use them
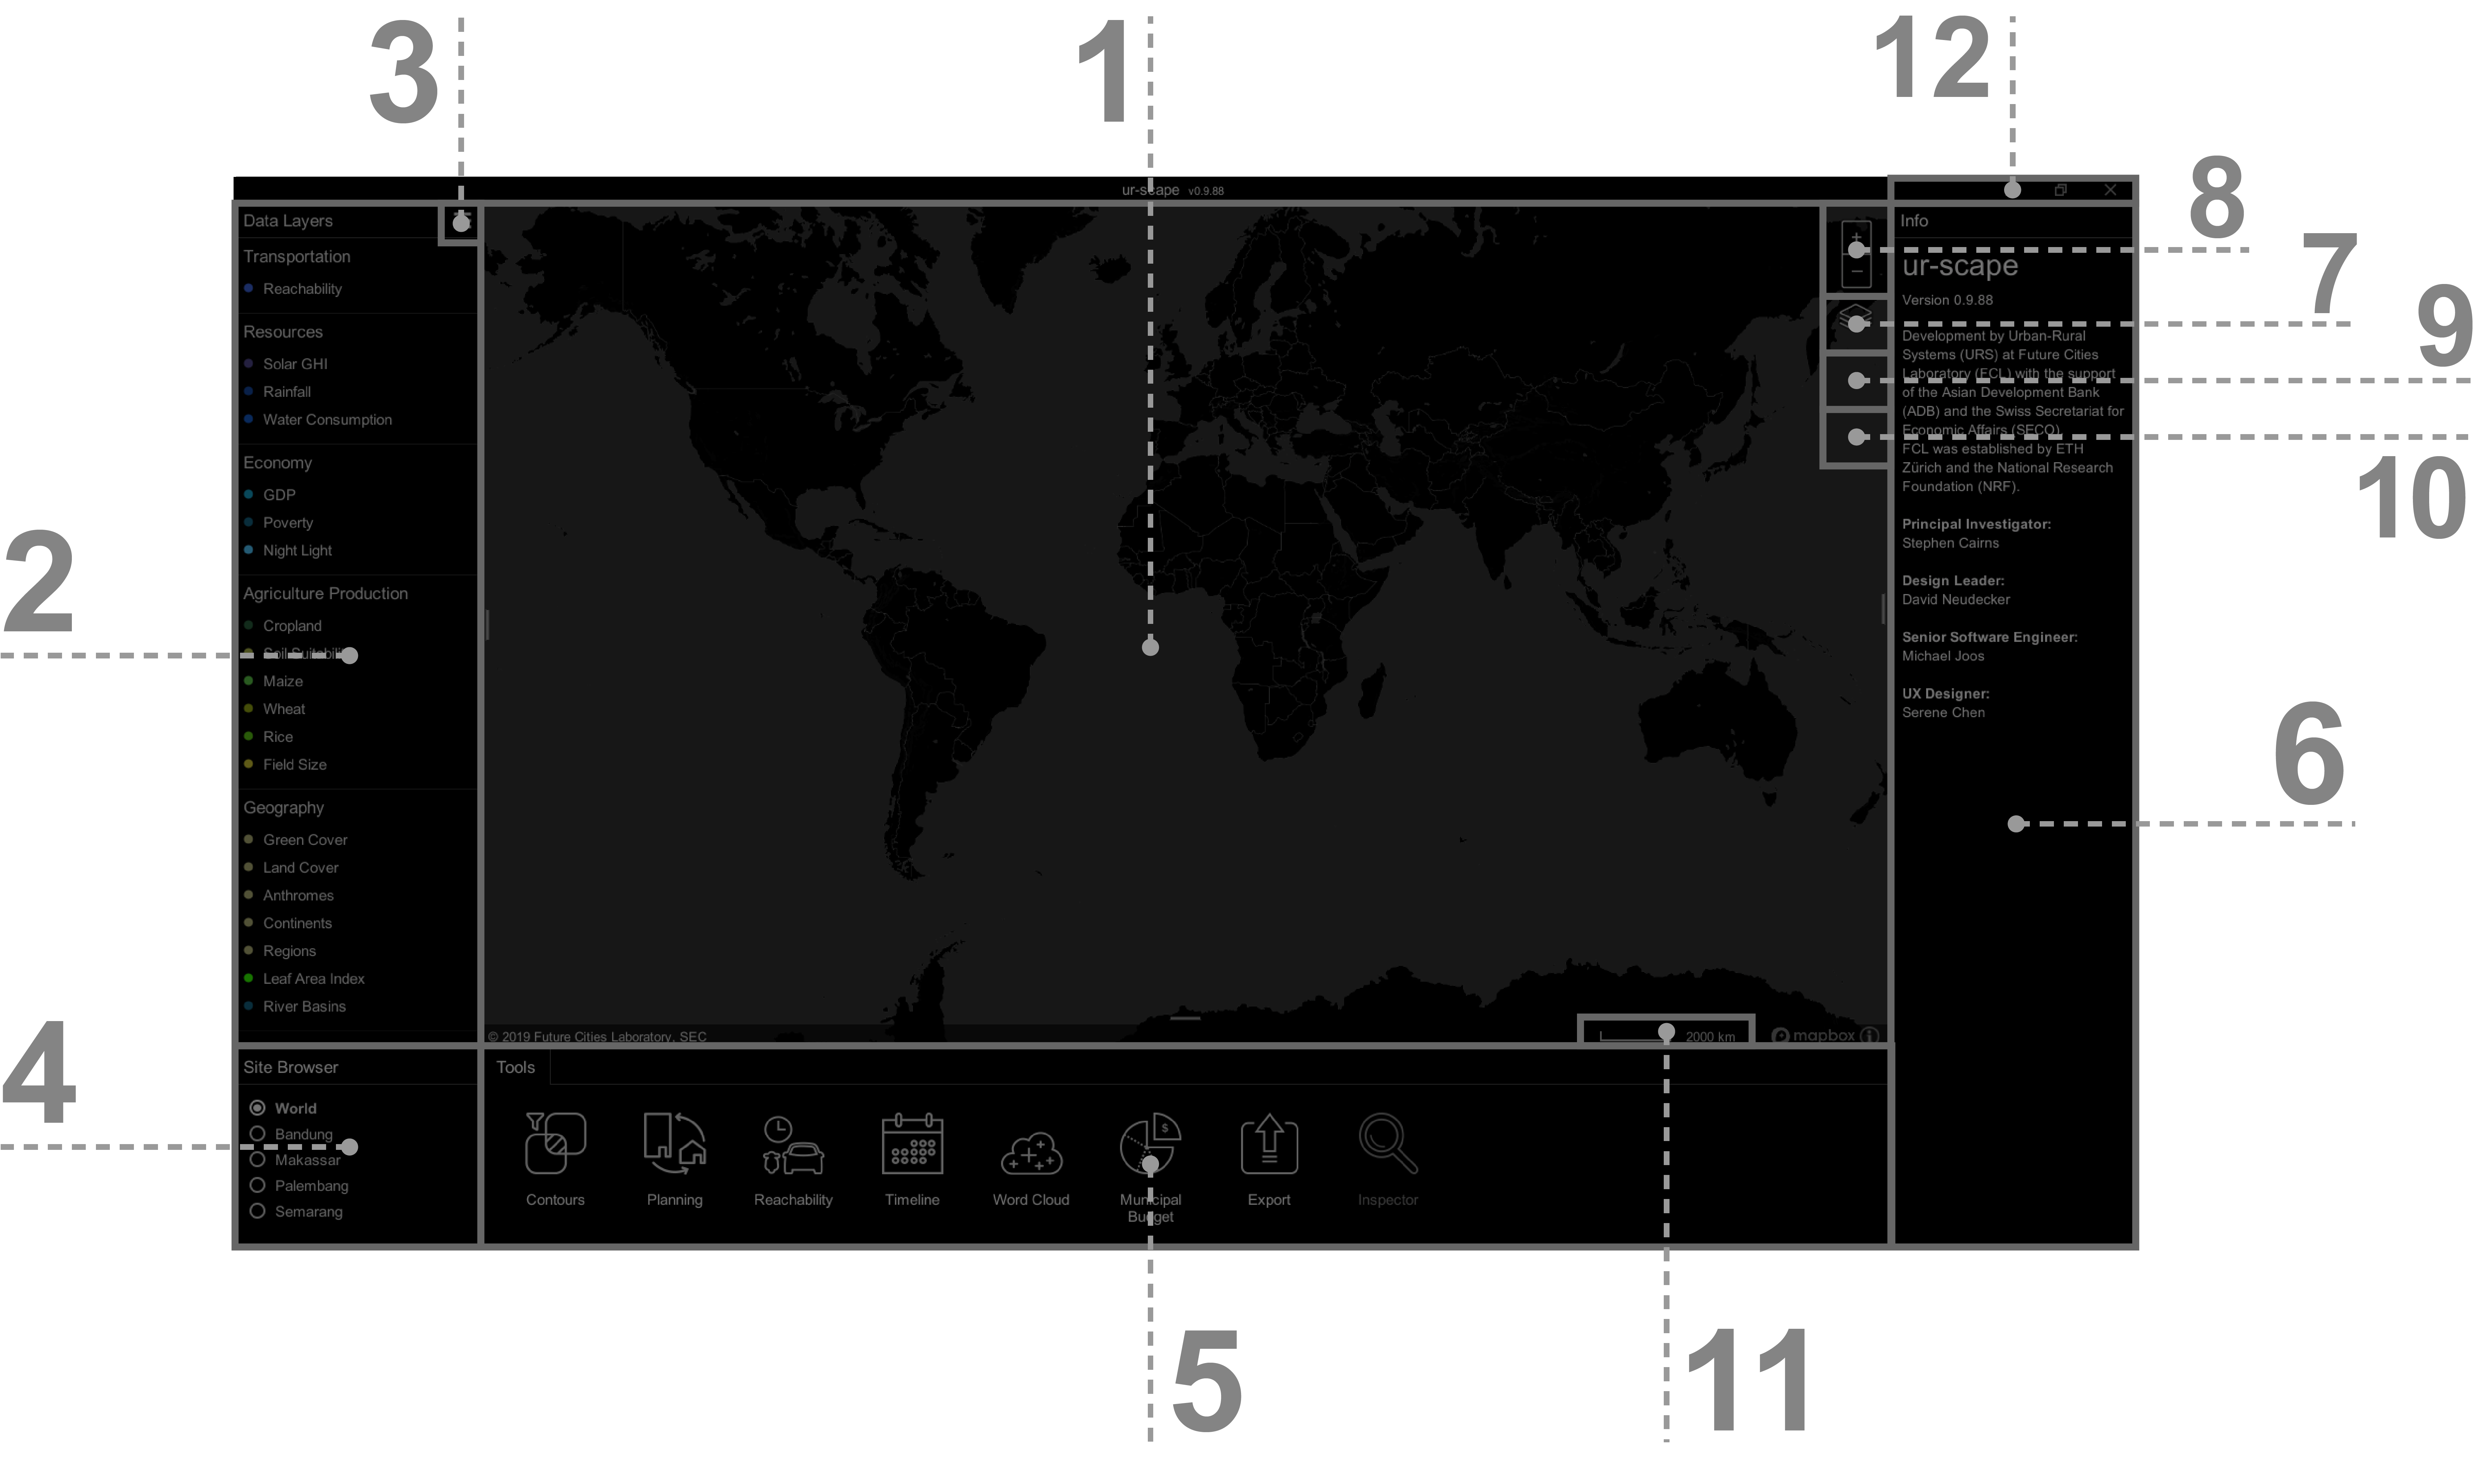
- Interactive Map is the area where the layer's data, background, and tool's results are visualized.
- Data Layers Panel contains all data layers organized into groups, which are available for the active site.
- Menu is a secondary menu where users can Customise Layers, Reset Layers, and also select additional settings.
- Site Browser shows available sites with site-specific data.
- Tools Panel contains all available tools available on ur-scape.
- Information Panel displays output information from the tool's analysis.
- Backgrounds gives users the choice of different background maps.
- Zoom Controls allows users to zoom in (+), or zoom out (-) the map.
- Compass allows users to reset the map view to default. The Compas only appears when the map view is not in its default state (facing true North and flat).
- Quick Inspect shows a secondary information box next to the cursor, which will contain values that the cursor is hovering over at any point in time.
- Scale Bar represents the scale of the map.
- Title Bar allows users to minimize, resize, or close ur-scape.
For more information please refer to User Guide
¶ Working with layers
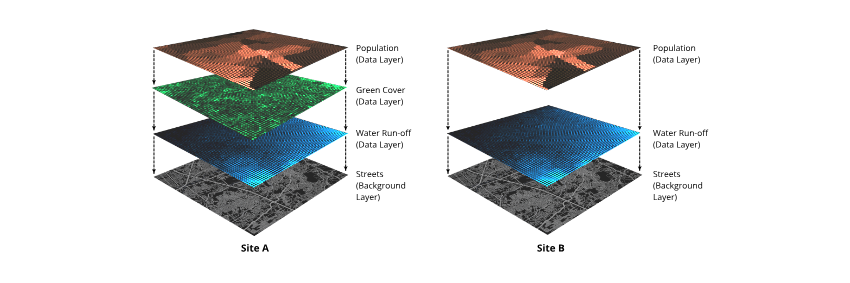
A core of working with ur-scape is in overlapping multiple Data layers. Each Data layer visualizes values for one data topic e.g Population Density, Rice Green Cover, Water Run-off, etc. Essentially every individual data set being imported into ur-scape will be an individual data layer.
Each Site in ur-scape contains its own unique set of Data layers that can be overlaid for visualization and analyses (as illustrated below).
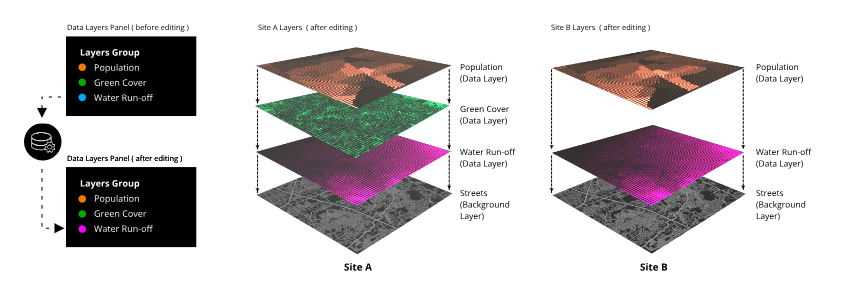
The order of these layers is organized across all sites, using the 'Organise Layers' function. Any changes made to a layer (i.e. spelling, display color, order) will be made to all instances of that layer across all sites.
¶ Mapbox
To use ur-scape to its full potential we recommend activating the Mapbox account, which allows users to get access to global coverage of various maps on the brought scale of zoom. The activation is easy and free (at the time of writing). A step by step tutorial on how to activate a Token in Mapbox is available.